- CPI
- PPI
- Oil ($/Barrel)
- Corn ($/Bushel)
- Wheat ($/Bushel)
- Cotton (¢/lb)
- Au ($/Toz)
- Ag ($/Toz)
- Cu (¢/lb)
- Cattle (¢/lb)
- Tin (¢/lb)
- Cocoa ($/Mton)
- Coffee (¢/lb)
- Hog (¢/lb)
- Lead ($/Ton)
- Zinc ($/Ton)
I then divided each commodity price by that month's CPI to get a ratio between the commodity and the "basket of market goods." Next I took each month's ratio and divided it by the Jan 1876 value for that commodity to see how "value" has changed for that commodity. So for example:
- CPI in Jan 1876 was 8.036, Gold was $23.356
- Jan 1876 Gold/CPI Ratio is 2.906
- CPI in Mar 2013 was 232.778, Gold was $1597.49
- Mar 2013 Gold/CPI Ratio is 6.862
- Comparison ratio between the two dates would be 2.361
- Over the time period CPI (inflation) increased about 29x, while Gold increased about 68x; the comparison ratio makes it clearer that gold outpaced inflation by more than double
Remember, the world is much different than it was 135 years ago; a lot of these changes may be due to changes in production, distribution, and government controls. Some of the results for Jan 1876 to Mar 2013:
- Oil ($/Barrel): 1.617 (+61.7% value since 1876)
- Wheat ($/Bushel): 0.242 (-75.8% % value since 1876)
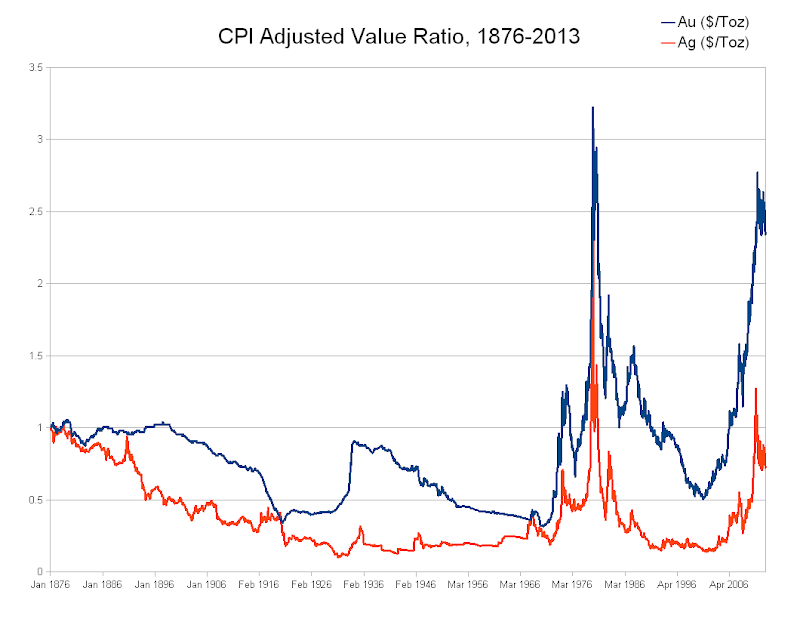
- Au ($/Toz): 2.361 (+136.1% value since 1876)
- Ag ($/Toz): 0.716 (-28.4% value since 1876)
- Cu (¢/lb): 0.463 (-53.7% value since 1876)
- Cattle (¢/lb): 1.285 (+28.5% value since 1876)
Here's Gold and Silver over the time period:
I did this all quickly, so please excuse mistakes for now (I'll clean up later if I am so inspired). Feel free to play around with the raw data: http://jmaii.3owl.com/commodities/. IMPORTANT: Excel has trouble with dates before 1900; I used OpenOffice.
I was also interested in data like Nickel prices and average wages, but those series don't start until the 20th century. Taking it easy for the rest of the week, but I can look into other possible data sets a little later.
